logstash + redis + elasticsearch + kibana3
23 Jul 2013
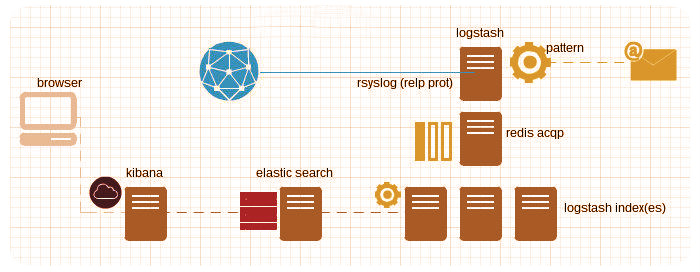
Composition applied to logging has been a great sucess lately, this week I’ve verified how easy is to use logstash and friends with 48 servers distributed in two datacenters, I’ve created a script to deploy all programs in a single node.
$ bash <(wget -qO- https://raw.github.com/javier-lopez/learn/master/sh/is/log-stack)
If you prefer using a node per service you’ll need to go your own way, it shouldn’t be too difficult.
##Extra, patterns
To send emails when a pattern is found, I used the grep and file logstash filters:
$ sudo service logstash-shipper stop
$ sudo vi /home/logstash/shipper.conf
$ sudo service logstash-shipper start
/home/logstash/shipper.conf
filter {
  grep {
    type => "syslog"
    match => ["@message","pattern"]
    add_tag => "Alert_flood"
    drop => false
  }

output {
  file {
    type => "syslog"
    tags => [ "Alert_flood" ]
    message_format => "%{@message}"
    path => "/tmp/logstash_alert"
  }
WARNING: shipper.conf doesn’t look exactly like this, these snippets must be integrated with your own files, copy and paste won’t work. If you’re not sure about the syntax, take a look at logstash documentation.
So, after rebooting the service logstash will add an “Alert_flood” tag to all messages where the pattern is found and will copy these messages (besides sending them to redis) to /tmp/logstash_alert.
Finally I wrote a script to send warning messages by email to the admins:
$ sudo crontab -l
*/1 * * * * /usr/local/bin/check_alerts_logstash.sh